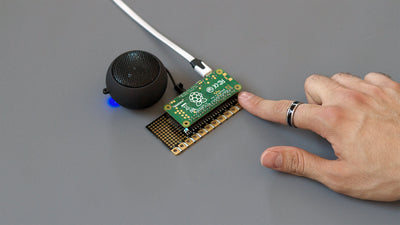
Visualize Pi Cap sensor performance with the grapher

Use the grapher to help you visualize and tune the performance of your Pi Cap'sCap's sensors
If you've been looking for a visualization of how sensitive the Pi Cap's Cap's touch sensors are, then this tutorial is for you! Use the grapher to plot the sensitivity and precision of the Pi Cap'sCap's sensors in a graph. Perfect for prototyping a new sensor design, testing a new material, or calibrating your project.
We love it when you share your projects! Post your project on Instagram, YouTube, or Twitter, and make sure to tag @bareconductive or use #bareconductive. You can also send your videos and photos to info@bareconductive.com so we can post them on our site for the world to see.
You will need:
- 1 x Pi Cap
- 1x Raspberry Pi 1 A+ or B+, Raspberry Pi 2 or Raspberry Pi 3 setup with the Pi Cap (see Step 1) or 1x Raspberry Pi Zero setup with the Pi Cap (see Step 1)
Step 1 Setup and choosing a method
If you haven't set up your Pi Cap before, then make sure to complete our setting up tutorials first:
Setting up your Pi Cap on the Raspberry
The first step is to decide how you want to connect to your Raspberry Pi. If you want to use a screen with the Raspberry Pi, then please proceed to Step 2.
Alternatively, if you want to use your machine and connect to the Raspberry Pi via a network connection, then please skip to Step 6.
Step 2 Download Processing
Once you have the Raspberry Pi running on a screen, the first step is to download Processing, the program we use to run our Grapher. Open the web browser and head to Processing.org, and download the Linux ARMv6hf version. You can find a link here:
Once downloaded head to the Download folder and double click the file. In the new window click ""Extract files"". Once again click ""Extract"". The Processing program should have now been extracted into your Downloads folder.

Step 3 Install the MPR121 grapher
Go to the Downloads folder and open the folder ""processing-3.2.1"". Depending on which version you downloaded, the numbers at the end of the name of the folder might change. Double click the file with the name ""processing"" and select ""Execute"" in the next window. This launches the Processor IDE. We now need to download the relevant libraries: ""ControlP5"" and ""oscP5"". In Processing, navigate to Sketch→Import Library→Add Library… in the top menu. Search for ""ControlP5"" and select ""Install."" Repeat the steps for ""oscP5"". When you have downloaded both libraries, close the Processing IDE.
The next step is to add the MPR121 grapher. You can find the MPR121 grapher library pre-installed in the folder /home /pi /PiCapExamples /Processing. If you can't find it, you can download it from Github:
The folder ""mpr121_grapher"" needs to be copied into /home/pi/sketchbook. Once you have done that you can reopen Processing and open the sketch via File→Sketchbook.

Step 4 Start it up
The code we need to run is written in three different programming languages: C++, Python and Node.JS. They all perform the same, so you can use whichever one you prefer. For now, we are going to use Python. Head to the folder /home /pi /PiCapExamples /Python /picap-datastream-osc-py, double click the run file and select ""Execute in Terminal"". This opens a Terminal window. Back in Processing within the MPR121 sketchbook, click ""Run"". In the next window choose ""OSC"". Now you see a scrolling display of data and when you touch electrode 0 you should see a reaction.

Step 5 All the data you need
The colored lines contain the following information: The red line is the filtered data. It should move when you touch the electrode selected in the top right box. The blue line is the baseline. The yellow and green lines are the touch and release thresholds as set in the code that is running. The vertical purple line indicates a touch event and the vertical white line indicates a release event.
That'sThat's it! You can now use the Grapher and tutorial whenever you want to check how sensitive the electrodes of your Pi Cap are.

Step 6 Download the Grapher
When running this project via a network connection, you need to download our MPR121 Grapher on your machine first. Our patch runs on the Processing program and if you don't already have Processing installed, you can download it here:
We first need to install two libraries: ""controlP5"" and ""oscp5"". To add the two libraries, open Processing and navigate to Sketch→Import Library→Add Library… from the top menu. Search for ""ControlP5"" and select ""Install"". Repeat these steps with for ""oscp5"".
The next step is to install the MPR121 Grapher. Download the Grapher on Github:
To add our MPR121 Grapher to Processing, the mpr121 folder needs to be moved to the Processing Sketchbook Folder. This will be different for each operating system:
Windows
Libraries/Documents/Processing or My Documents/Processing
Mac
Documents/Processing
Linux (Ubuntu)
Home/Processing
If this folder does not exist, you have to create it first.

Step 7 Run the data stream code
The code we're going to run is written in three different programming languages: C++, Python and Node.js. They all do the same so you can use whichever one you want, but in this tutorial, we'llwe'll use the Python file.
Once you have logged into your Raspberry Pi via ssh, head to the folder ""picap-datastream-osc-py"", simply by entering ""cd ~/PiCapExamples/Python/picap-datastream-osc-py"". At this point, you need to know the hostname of your machine.
Back in your Terminal window, type ""./run -h HOSTNAME"", where HOSTNAME is your host name and hit enter. The code is now running and we are done here. If you want to quit the code, use enter ""Ctrl"" + ""C"".

Step 8 Run the grapher
Head back to Processing with the mpr121_grapher sketch open and hit run. In the next window choose ""OSC"". You should now see a grey graph with colored lines. Now you see a scrolling display of data and when you touch electrode 0 you should see a reaction.
The colored lines contain the following information: The red line is the filtered data. It should move when you touch the electrode. The blue line is the baseline. The yellow and green lines are the touch and release thresholds as set in the DataStream code that is running. The vertical purple line indicates a touch event, and the vertical white line indicates a release event.
That's it! You can now use the Grapher and tutorial whenever you want to check how sensitive the electrodes of your Pi Cap are.


